For most commercial buildings, energy is the single largest operating expense, most of which comes in the form of electricity. That being the case, the cost of utility-supplied power is of major concern to property managers searching for ways to lower costs. But controlling and cutting energy costs doesn’t happen overnight—it’s part of a larger educational process that starts with learning more about how you’re being billed, your industry’s energy profile, and your building’s specific energy dynamic.
To that end, a common question is this: What is the average utility cost per square foot for commercial property? We’ll answer that—and provide some related information on how industry energy profiles can be useful—in the sections that follow.
What is the average utility cost per square foot for commercial property?
The answer: The average cost of utilities for commercial buildings is $2.10 per square foot.
Other interesting facts related to how much utilities cost for a business:
- The total electricity expense for private-sector office buildings in 2016 was $1.69 per square foot.
- According to the 2012 Commercial Building Energy Consumption Survey (which was being updated as of 2018), commercial buildings spend $1.44 per square foot per year on electricity and $0.30 per square foot per year on natural gas.
- In 2018, refrigeration was the largest single use of electricity in the commercial sector, accounting for 13.9% of spending. For U.S. manufacturers, machine drives (motors) were the largest use of electricity.
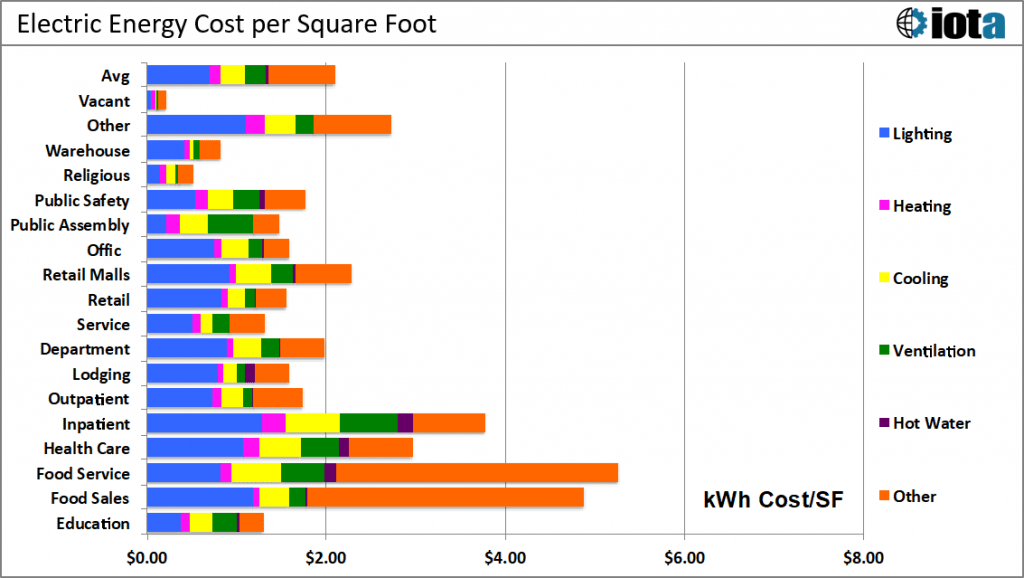
- According to the U.S. Department of Energy, the average number of kilowatt hours per square foot for a commercial building is approximately 22.5. (You can see the breakdown on how energy is used here.) A food service facility consumes approximately 56 kWh/square foot, a retail mall 23, a public assembly building 15, and a warehouse 9.
- Looking ahead to 2050, lighting is expected to show the greatest reduction in electricity intensity (54%) thanks to more commercial buildings replacing incandescent bulbs with LED bulbs and compact fluorescent lamps.
- On-site electricity generation via solar is expected to increase by an average of 5% per year for commercial buildings.
- The three states with the highest commercial utility rates are Hawaii, California, and Alaska. (See the chart below for further rankings.)
What factors contribute to the cost of energy?
[bctt tweet=”The cost of electricity is based on a number of variables, including the time of day you’re using it, the season of the year (summer rates can be higher than winter rates due to higher energy demand), and where you live.” username=”iotacomm”]
In combination with the factors listed above, you are billed based on your energy consumption and demand. Different industries have different requirements for energy use—for example, some buildings, like hospitals, operate 24/7, and food service facilities must power refrigeration units constantly. Other facilities, like schools, are open during limited hours and even close during the summer. Your energy demand is also a big factor in what you pay: Your maximum hourly power requirement over a billing cycle forms the basis of a utility’s demand charge, and comprises a significant portion of your bill.
Find out how you can reduce your energy costs in the peak demand and consumption areas up to 40% with remote monitoring.
How You Can Use Industry Energy Data To Reduce Your Operating Expenses
There are mountains of data related to industry energy use—use it to your advantage by benchmarking.
Facilities that benchmark have, on average, been able to reduce their energy consumption 8% in the first year and 40% over 10 years.
Benchmarking is the process of measuring your building’s energy performance against that of other buildings, with an eye toward making improvements. You need two things to be able to benchmark your building’s energy use:
- Energy use data for buildings similar to yours and in the same industry. The U.S. Department of Energy, the U.S. Energy Information Administration, Building Managers & Owners Association, and other organizations regularly conduct studies and surveys regarding energy use; they provide numerous metrics that paint a picture of energy-related spending and consumption across industries. (Our Energy Benchmarking Report can get you started.)
- Your own building’s energy consumption data. Once you have a better understanding of how your industry peers are consuming energy, you need something to compare, which means you need to start gathering data that shows your own building’s energy patterns and consumption. Over a period of time, you’ll gain a better understanding of what activities are associated with your energy usage, including what you’re spending the most money on.
Many building managers are already collecting this type of data with the help of the Internet of Things (IoT).
How To Use The IoT To Decrease Utility Costs
Your utility bill tells how many megawatt hours of energy your building used over a certain period of time, but that data isn’t detailed enough to be of much help. For example, your bill won’t show how energy is consumed—for example, how much electricity your HVAC uses vs. lighting. It also won’t reveal your energy use patterns, such as when the most water is typically used or when your HVAC consistently works overtime. Benchmarking—and taking follow-up action to decrease utility costs—requires having specific data about your building’s subsystems that can be compared and analyzed.
The IoT gives you the ability to understand how your building works on a more granular level. Wireless IoT sensors are capable of monitoring any of your facility’s subsystems—lighting, HVAC, machinery, water, and more—with great accuracy. Gaining a better understanding of your energy profile naturally exposes inefficiencies, and allows you to make meaningful comparisons with industry competitors that will further reveal areas ripe for improvement.
For example, continuous monitoring by IoT sensors might reveal that…
your HVAC system uses more energy than the average comparable building in your industry, and that it’s responsible for the largest portion of your energy spending. Further investigation shows that it turns on every day three hours before the first employee arrives at work. You could potentially save tens of thousands of dollars simply by turning the system on two hours later.
Another example of benchmarking and targeted action:
If your average utility cost per square foot of commercial property is higher than that of your competitors, you may decide to implement IoT monitoring to understand why. A few weeks’ worth of data reveals a pattern: Most of your high-power equipment and building systems are operating during the electric company’s hours of high demand. You could again save thousands by alternating HVAC operation by floor for an hour at a time, scaling back on lighting where appropriate, and timing the use of high-power equipment to avoid operation at those key times.
One of our customers implemented IoT sensor monitoring after noticing an unusual increase in its water bill. The result:
IoT sensors revealed that one of its water-cooled refrigeration units was continuously calling for water circulation, wasting more than 10,000 gallons of water daily. After addressing the issue, this customer now saves more than $115,000 annually on its water bill.
You can get as granular as you like with the IoT, monitoring the energy consumption of individual pieces of equipment, specific processes, specific floors or even rooms. The more data you collect and analyze, the more opportunities you’ll have to make meaningful changes for the better.
Looking for ways to lower your building’s utility costs?
If you’re looking for ways to improve your building’s performance, getting your energy profile is the first step.
Iota’s team of IoT experts can get the job done. Tell us about your goals for your facility, and we’ll work with you to design an appropriate data collection strategy, decipher all the data from your sensors, and offer guidance and recommendations around how best to reach your goals. We’ve helped numerous Fortune 100 clients decrease their facility’s energy consumption—and by extension their utility costs; let us do the same for you! To learn more, visit our website or talk to us.