All around the world, the gears of business are starting to turn once again—albeit slowly. After months of nonessential business closures due to COVID-19, there are now signs of life, with some companies having reopened already and others making plans to do so soon.
But Americans are worried. A recent poll shows that 54% of U.S. employees are concerned about the risk of contracting Coronavirus at work. And people are right to be concerned: Studies have shown that most COVID-19 cases were transmitted indoors, and evidence of how fiercely the virus spreads in high-density work environments is coming to light.
Now more than ever, building owners must make health and safety—including indoor air quality—a priority. Indoor air quality heavily impacts the transmission of airborne diseases, and thus requires special emphasis. Smart building analytics has tremendous potential in this area. Keep reading to learn how building analytics software can be used as part of a healthy building strategy, and why it’s key to providing peace of mind for occupants.
Want to assess the quality of your building’s air? Talk to us at Iota—we can help you get started.
Smart Building Analytics For Indoor Air Quality: Monitor, Measure, & Minimize Risk
Of course, there are many aspects involved in planning for a safe return to buildings, including cleaning protocols, social distancing guidelines, employee screening, and more; indoor air quality is one of them. According to the CDC, COVID-19 is spread in part through respiratory droplets when an infected person coughs, sneezes, or talks. Those droplets containing the virus can travel, filling a room over the space of several hours and potentially infecting everyone who breathes the air.
Air droplets are invisible to the naked eye, which means you and your occupants can’t “see” whether or not a room is safe. But Internet of Things (IoT) sensors—a foundational component of smart building analytics—are capable of detecting and measuring certain characteristics of air quality that indicate if the environment presents a high or low risk for airborne virus transmission. While much of the scientific information around COVID-19 is still a work in progress, the following are important indicators as to the overall quality of air, and the extent to which it will support the spread of disease:
- Too high or too low humidity levels have been shown to support the spread of viruses. Some studies suggest that an indoor relative humidity level within a range of 40% to 60% is ideal.
- Temperature has also been shown to play a role in how long the droplets can survive. Higher temperatures seem to slow the spread.
- High CO2 levels indicate that not enough fresh air is being supplied, and that more ventilation is needed. Some studies have shown that improving ventilation significantly lowers the amount of time respiratory droplets stay airborne.
- Volatile Organic Compounds (VOCs) are organic chemicals emitted as gases from products such as cleaning agents, air fresheners, carpet and flooring material, etc.; they are one of the primary contributors to indoor pollution, and have been shown to have negative health effects on building occupants. Increased disinfecting of surfaces resulting from COVID-19 is likely to produce high levels of VOCs in the air.
As a building manager, you need a way to know when your facility’s air becomes unsafe so you can address it quickly. You also need a way to provide peace of mind for occupants. Both are among the benefits of “smart” buildings.
[bctt tweet=”As a building manager, you need a way to know when your facility’s air becomes unsafe so you can address it quickly. You also need a way to provide peace of mind for occupants.” username=”iotacomm”]
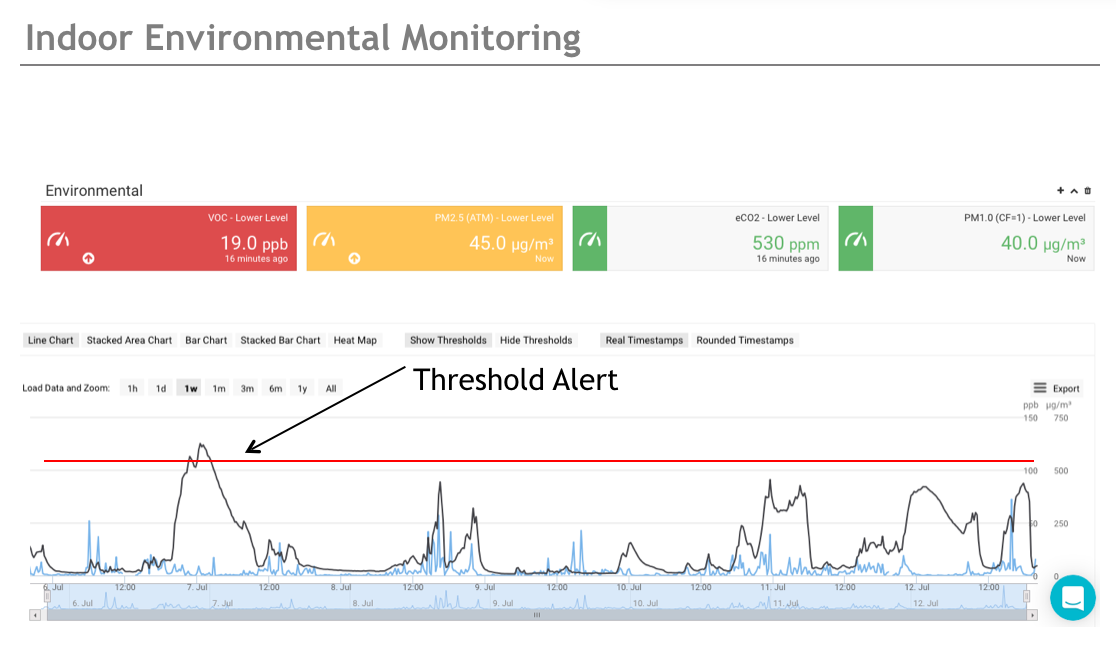
Smart buildings incorporate indoor air quality monitoring equipment that can help you measure the characteristics listed above (and more). Sensors placed strategically throughout your building take air samples at regular intervals and send that data to the cloud, where you can access it via building analytics software. You get immediate, real-time access to the monitoring results via an easy-to-read dashboard, which turns the data into charts that paint a picture of your building’s indoor air quality at all times. Those dashboards can easily be shared with occupants to provide peace of mind that the space they’re working in is safe, and that you, as a building owner, are doing everything you can to protect their health.
Your building analytics platform can also be set up to provide threshold alerts. If, for example, CO2 levels fall outside of a predetermined acceptable range, your monitoring equipment will alert you. From there you can take the appropriate action to resolve the situation immediately.
From Analytics To Action
Smart building analytics isn’t just about collecting data—the purpose of a building analytics platform is ultimately to analyze that data over time and produce actionable insights you can use to improve.
There is no single prescribed method for improving indoor air quality. The approach you’ll take may depend on a number of factors, including your individual building’s characteristics, occupancy levels, and the activities taking place within the building. For example:
- ASHRAE has found that heating, cooling, and ventilation systems can be used strategically to help reduce airborne exposures. But not all HVAC systems are sized correctly for the buildings they serve; some are under- or oversized. Air quality monitoring could reveal that some spaces within the building are not adequately ventilated even if you’re following guidelines around the number of people occupying a space. In that case, you may need to reduce the number of occupants in the area.
- Sometimes air quality issues are related to building activities. For example, if CO2 levels inside a school hallway rise when students switch classes, the solution may simply be to make sure your vents are running on high for each of those 10-minute periods throughout the day.
- Air quality issues associated with high-touch areas may require a solution as simple as disinfecting those surfaces more frequently to prevent the virus from re-entering the air.
- For some spaces where proper ventilation is a challenge, installing an air purifier might be helpful to reduce airborne contaminants.
Air quality data is another tool you can use to better understand your building, and devise smarter solutions to create healthy spaces.
Reopen Safely With Iota Building Analytics Software
Whether your building is an office, a manufacturing facility, a school, a mall, or anything else, Iota’s building analytics platform can help you reopen your space with confidence.
When you partner with us, you’ll get access to real-time air quality data using our line of IoT sensors, which allow you to remotely monitor your building’s temperature, humidity, CO2, VOCs, and more. We’ll also help you decipher the data using our advanced building analytics software, which includes an easy-to-read dashboard of environmental conditions that’s accessible to you anytime, from anywhere. Finally, we’ll offer recommendations about ways you can mitigate risk and improve your building’s overall air quality.
Today, the benefits of smart buildings go well beyond operating and cost efficiencies—they now include human health and peace of mind. If you’d like to learn more about Iota’s building analytics platform and how it might work for you, contact us—we’d love to help.